|
|
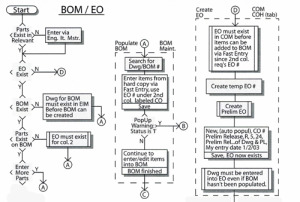
| Flow charts have been around a long time. Mostly they were used by programmers to help follow the program they were building. Then it was discovered that they were beneficial to humans to follow to help prevent confusion when it required decisions to make.You can remember when cars were first made, they created an assembly line process that helped decide what step was next and what parts were needed to complete that step.
The process of decision making can help many situations, even those emergency types when quick thinking is needed based on the problem. Having a problem solving flow chart that a user can follow and solve problems without having to stop the line of production to call a supervisor is another time saver. The yes / no decision tree is a result of department heads getting together and brainstorming every possible problem that could happen, and providing solutions that allow the process to continue without interruption. Updates to the decision tree can be expected until all the bottle neck problems are worked out.
Providing an Easy To Read guide is essential for the user to move past the problem area by solving the issue using easy to follow solutions the brain storming sessions developed. Allowing the user to submit additional solutions that had not been considered is a must since they are the primary user and will help develop it into a smooth running machine.
I use the right tools for the job to keep a consistent look of the Decision Tree is essential so that the user doesn’t get confused by multiple representations for the same decision point. The flow representation is basically the same as developing a computer program flow chart. Since its assumed that the computer or machine being run by the program knows nothing except what it’s told, then every step must be covered. The same is for the new person in the decision flow. You must have a Decision Tree that assumes the newbie knows nothing except what they’re told, and the flow chart provided must solve any question that may arise during the decision process.
Let me help you help the end user to minimize their learning curve and maximize your bottom line. If this process sounds like something you would be interested it, please contact me and let talk.
|
|
